


Data Visualization and Interaction at Cincinnati
Helping people connect with their data and each other.

Research
Our group is Data Visualization and Interaction at Cincinnati (DaVInCi). Our research is in data visualization, human-computer interaction and computer graphics. We think about how to design interactive visualizations and collaborative environments to bring data into focus so we can generate insights, communicate findings and make better decisions.
DaVInCi@Langsam
Collaborate better. This environment in Langsam Library, the main library at the University of Cincinnati, is designed to support collaboration in research and teaching at UC. It offers a large display and specialized software which allow everyone in the room to share content and interact. Ongoing research is exploring new ways to interact with displayed content on the expansive display.


Team
Meet our group


MS Student
Sai Pranathi Athota
Research: Smart assistants for meetings about data
-


MS Student
Varsha Govardhanam
Research: Interaction beyond mouse and keyboard
-

MS Student
Jenn Gutman
Research: Visualization for resilient communities.
-


PhD Student
Pak Kwan
Research: Meetings beyond the projector
-

PhD Student
Vivek Mehra
Research: Embodied Interaction in Collaborative Spaces
-
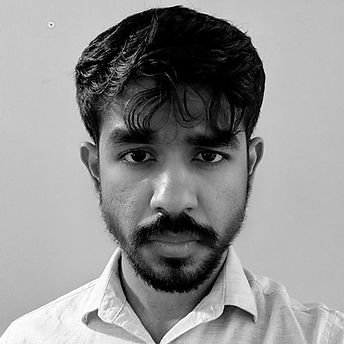
PhD Student, MS Alum
Rizul Sharma
Research: Smart assistants for meetings about data
-

PhD Student
Joshua Shell
Research: Explainable AI, Biological Data Visualization
-

MS Student
Aleksander Yermakov
Research: Visualization for spatial data
-
Publications


Why DaVInCi?
We are inspired by classical scientists and inventors, like Leonardo Da Vinci, whose work was powered by visual thinking. During the Renaissance, scientists and engineers were also trained to be artists. They understood that the best inventions first needed to be captured on paper. They understood that science required viewing the world carefully, aided by optical instruments like telescopes, and communicating these observations through sketches and diagrams. We aim to build a community of visual thinkers at the University of Cincinnati to solve today's biggest challenges.